Financial Highlights
Operating Results
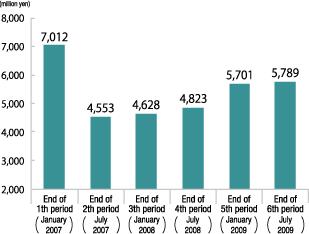
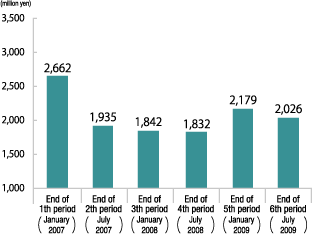
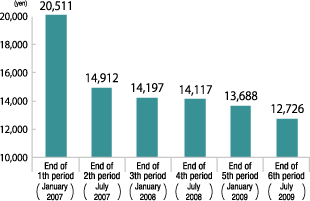
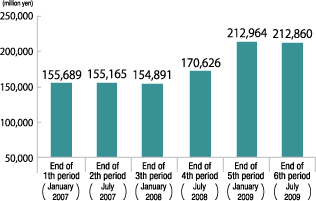
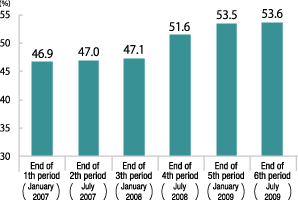
1st fiscal period (January 2007)-6th fiscal period (July 2009)
Operating revenues
Net income
Dividend per unit
Total assets
LTV (book value basis)
- (Note)
- The first fiscal period is from February 2, 2006 to January 31, 2007.
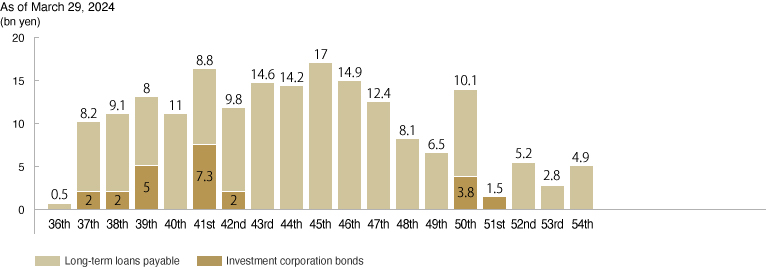
Diversification of borrowing maturities
Diversification of borrowing maturities