【全】H1

Capitalization and Major Unitholders

Composition of unitholders

Composition of Unitholders

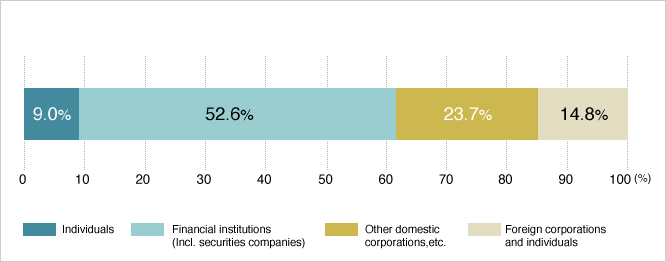
Unitholder Ownership Categories

(as of January 31, 2024)
Type of Unitholder Unitholders Investment units
# of
Unitholders
Share (%) # of
Units
Share (%)
Individuals 15,067
95.5
144,105
7.5
Financial institutions
(incl. securities companies)
162
1.0
1,162,232
60.6
Other domestic corporations 250
1.6 325,246
17.0
Foreign corporations and
individuals
293
1.9
284,747
14.9
Total
15,772
100 1,916,330
100

Number of Investment Units

(as of January 31, 2024)

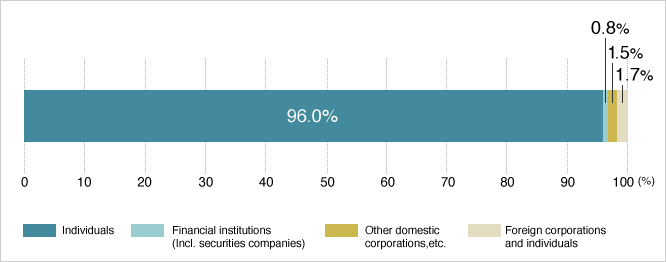
Number of Unitholders

(as of January 31, 2024)


Major unitholders

(as of January 31, 2024)
Name # of Units Held Share% (Note)
Custody Bank of Japan, Ltd. (Trust account) 496,337
25.9
The Master Trust Bank of Japan, Ltd. (Trust account) 292,522
15.3
Mori Building Co., Ltd.
287,472
15.0
The Nomura Trust & Banking Co., Ltd. (Investment trust account) 80,930
4.2
STATE STREET BANK WEST CLIENT - TREATY 505234
25,086
1.3
JP MORGAN CHASE BANK 385771
22,141
1.2
Custody Bank of Japan, Ltd. (Money trust taxable account)
21,868
1.1
LEGAL + GENERAL ASSURANCE PENSIONS MANAGEMENT LIMITED
19,684
1.0
SMBC Nikko Securities Inc.
19,498
1.0
The Shinkumi Federation Bank
18,756
1.0
Top 10 unitholders total
1,284,294
67.0
(Note) "Share" refers to the ratio of the total number of investment units issued to investment units held, rounded up to one digit below decimal point.

Capitalization

Capitalization

(as of September 25, 2020)
Total equity JPY 195,718,191,720
Authorized number of units 10,000,000 units
Units issued and outstanding 1,916,330 units
Date Description Unitholders' capital
(millions of yen)
Number of investment units
issued and outstanding
(units)
Increase
(Decrease)
Balance Increase
(Decrease)
Balance
February 2,
2006
Incorporation 100 100 200 200
March 20,
2006
Capital increase
through
third-party allotment
12,385 12,485 24,770 24,970
April 13,
2006
Capital increase
through
third-party allotment
30,941 43,426 61,882 86,852
July 31,
2006
Capital increase
through
third-party allotment
4,239 47,665 8,398 95,250
November 29,
2006
Capital increase
through
public offering
25,005 72,671 34,550 129,800
September 29,
2008
Capital increase
through
third-party allotment
14,700 87,371 29,400 159,200
March 23,
2010
Capital increase
through
public offering
13,562 100,934 67,000 226,200
April 23,
2010
Capital increase
through
third-party allotment
1,076 102,010 5,320 231,520
March 4,
2013
Capital increase
through
public offering
10,433 112,444 22,000 253,520
April 3,
2013
Capital increase
through
third-party allotment
521 112,966 1,100 254,620
September 4,
2013
Capital increase
through
public offering
10,823 123,789 21,300 275,920
October 2,
2013
Capital increase
through
third-party allotment
541 124,330 1,065 276,985
February 1,
2014
Split of investment units - 124,330 1,107,940 1,384,925
August 1,
2014
Capital increase
through
public offering
24,844 149,175 176,300 1,561,225
August 27,
2014
Capital increase
through
third-party allotment
1,242 150,418 8,815 1,570,040
February 1,
2016
Capital increase
through
public offering
22,679 173,097 172,000 1,742,040
February 24,
2016
Capital increase
through
third-party allotment
1,133 174,231 8,600 1,750,640
August 1,
2018
Capital increase
through
public offering
15,455 189,687 118,400 1,869,040
August 22,
2018
Capital increase
through
third-party allotment
772 190,460 5,920 1,874,960
August 31,
2020
Capital increase
through
public offering
5,007 195,467 39,400 1,914,360
September 25,
2020
Capital increase
through
third-party allotment
250 195,718 1,970 1,916,330