【H1】Financial Highlights

Financial Highlights

Financial Highlights

Operating Results

19th fiscal period (January 2016)-24th fiscal period (July 2018)

Operating revenues
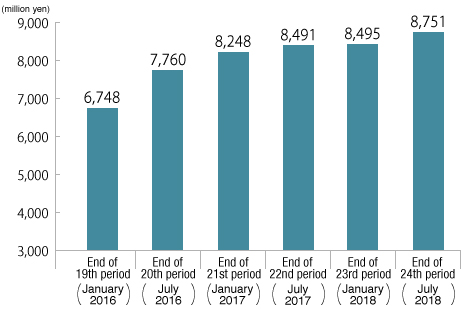
※As the accounting policy was changed in the twenty-first fiscal period, the figures for the twentieth fiscal period are figures after retrospective application. The same applies hereafter.

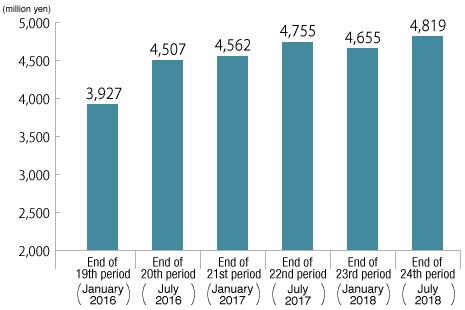
Net income
Dividend per unit
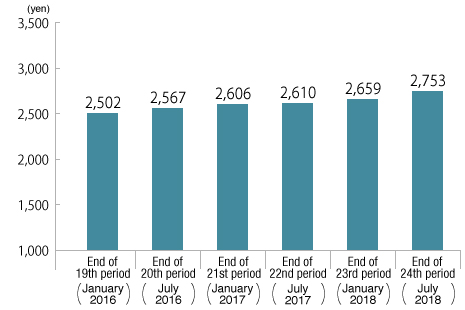
※A 5-for 1 split of investment units was implemented on February 1, 2014.

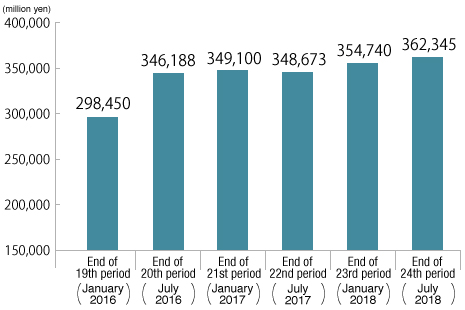
Total assets
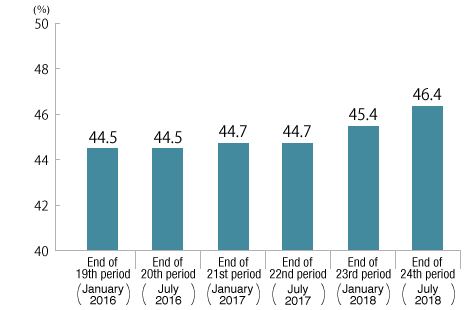
LTV (book value basis)
Change in Financial Highlights (Excel:30KB)

19th
fiscal period
(2016 January)
20th
fiscal period
(2016 July)
21st
fiscal period
(2017 January)
22nd
fiscal period
(2017 July)
23rd
fiscal period
(2018 January)
24th
fiscal period
(2018 July)
Operating revenues
(millions of yen)
6,748 7,760 8,248 8,491 8,495 8,751
Operating income
(millions of yen)
4,566 5,160 5,207 5,395 5,287 5,432
Ordinary income
(millions of yen)
3,928 4,514 4,566 4,756 4,657 4,820
Net income
(millions of yen)
3,927 4,507 4,562 4,755 4,655 4,819
Dividend per unit
(yen)
2,502 2,567 2,606 2,610 2,659 2,753
Number of
investment units
1,570,040 1,750,640 1,750,640 1,750,640 1,750,640 1,750,640
Total assets
(millions of yen)
298,450 346,188 349,100 348,673 354,740 362,345
Net assets
(millions of yen)
154,452 178,853 178,921 179,115 179,202 179,366
Net assets per unit
(yen)
98,374 102,164 102,203 102,314 102,363 102,457
LTV
(book value basis)
44.5% 44.5% 44.7% 44.7% 45.4% 46.4%
Interest-bearing
debt
(millions of yen)
132,700 154,000 156,000 156,022 161,222 168,122
Short-term
borrowings
(millions of yen)
- - - - - -
Long-term
borrowings
(millions of yen)
108,700 130,000 128,000 126,022 133,222 143,122
Investment
corporation bonds
(millions of yen)
24,000 24,000 28,000 30,000 28,000 25,000
Long and short-term
debt ratio
100.0% 100.0% 100.0% 100.0% 100.0% 100.0%
Fixed rate ratio 70.6% 61.5% 62.0% 62.0% 62.5% 70.6%
(Note 1)
Net income per unit for the periods with capital increase are calculated based on the average number of investment units during the period.
(Note 2)
As the accounting policy was changed in the twenty-first fiscal period, the figures for the twentieth fiscal period are figures after retrospective application.

Diversification of borrowing maturities

Diversification of borrowing maturities