Financial Highlights
Operating Results
25th fiscal period (January 2019)-30th fiscal period (July 2021)
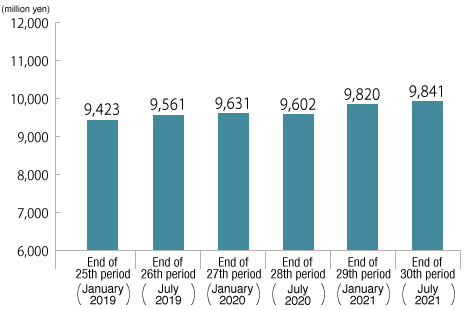
Operating revenues
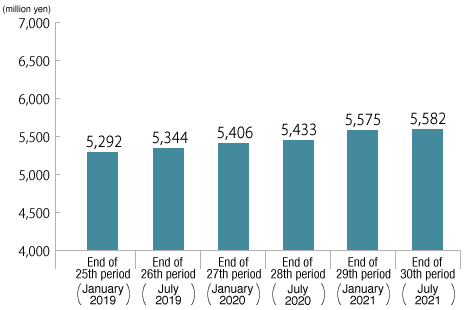
Net income
Dividend per unit
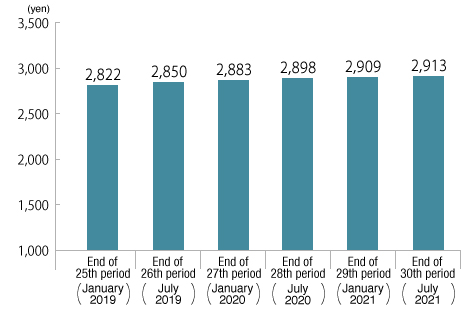
※A 5-for 1 split of investment units was implemented on February 1, 2014.
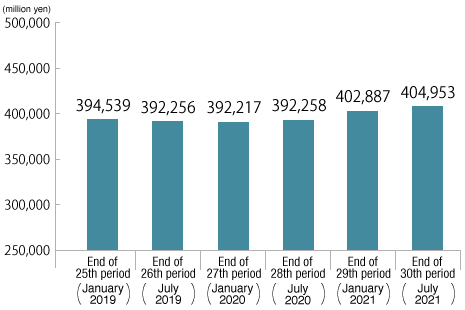
Total assets
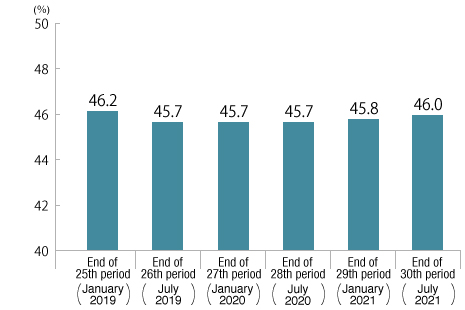
LTV (book value basis)
Change in Financial Highlights (Excel:31KB)
- (Note)
- Net income per unit for the periods with capital increase are calculated based on the average number of investment units during the period.
Diversification of borrowing maturities
Diversification of borrowing maturities
