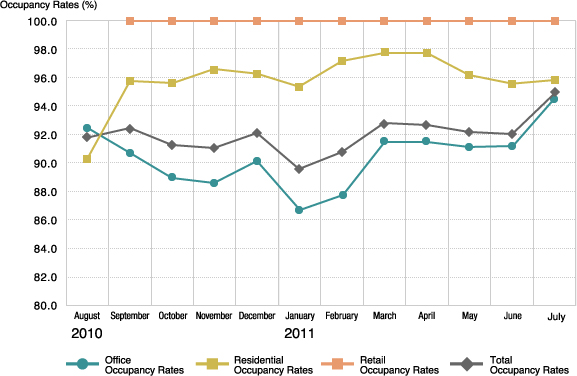
Trend in Occupancy Rates
Trend in Occupancy Rates
9th fiscal period (January 2011)・10th fiscal period (July 2011)
Detail of Occupancy Rates
10th fiscal period
(July 2011) |
February
2011 |
March |
April |
May |
June |
July |
Occupancy
rates
(%) |
Office |
87.7 |
91.5 |
91.5 |
91.1 |
91.1 |
94.5 |
| Residential |
97.1 |
97.7 |
97.7 |
96.2 |
95.5 |
95.8 |
| Retail |
100.0 |
100.0 |
100.0 |
100.0 |
100.0 |
100.0 |
| Total |
90.7 |
92.7 |
92.7 |
92.1 |
92.0 |
94.9 |
Total
leasable
floor
area
(㎡) |
Office |
66,480.66 |
80,194.63 |
80,194.63 |
80,194.63 |
80,194.63 |
80,194.63 |
| Residential |
27,188.16 |
15,872.95 |
15,872.95 |
15,872.95 |
15,872.95 |
15,872.95 |
| Retail |
2,565.06 |
2,565.06 |
2,565.06 |
2,565.06 |
2,565.06 |
2,565.06 |
| Total |
96,233.88 |
98,632.64 |
98,632.64 |
98,632.64 |
98,632.64 |
98,632.64 |
9th fiscal period
(January 2011) |
August
2010 |
September |
October |
November |
December |
January
2011 |
Occupancy
rates
(%) |
Office |
92.5 |
90.7 |
89.0 |
88.6 |
90.1 |
86.7 |
| Residential |
90.2 |
95.7 |
95.6 |
96.5 |
96.2 |
95.3 |
| Retail |
- |
100.0 |
100.0 |
100.0 |
100.0 |
100.0 |
| Total |
91.8 |
92.4 |
91.2 |
91.1 |
92.1 |
89.5 |
Total
leasable
floor
area
(㎡) |
Office |
73,001.00 |
66,480.66 |
66,480.66 |
66,480.66 |
66,480.66 |
66,480.66 |
| Residential |
33,590.38 |
27,188.16 |
27,188.16 |
27,188.16 |
27,188.16 |
27,188.16 |
| Retail |
- |
2,565.06 |
2,565.06 |
2,565.06 |
2,565.06 |
2,565.06 |
| Total |
106,791.38 |
96,233.88 |
96,233.88 |
96,233.88 |
96,233.88 |
96,233.88 |
- (Note1)
- Rentable floor space is rounded to the one-hundredth decimal point. For property jointly owned with third parties, rentable floor space is calculated by multiplying MHR's ownership by the entire building's rentable floor area. The occupancy rates are rounded to the one-tenth decimal point.
- (Note2)
- Properties are divided into office or residential according to the main purpose of use for each property.
- (Note3)
- On November 30, 2010, we amended the occupancy rates for the end of February, 2010 as follows.
|
Office |
| End of February 2010 |
92.6%→92.8% |
※There were no amendments for the office properties.